After you’ve followed the steps to get to browser console, now we will guide you to get the network tab error message.
1. Go to the Network Tab
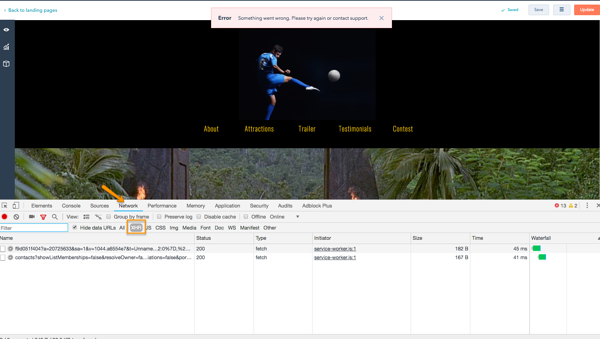
2. Refresh The Page
Click the Refresh button in your browser. Since the Network tab will only show us the requests that occur after the tab has been opened, we’ll need to refresh the page so that we can view the error as it occurs. As the page reloads, you’ll see various API requests populate the panel. It should look something like this:
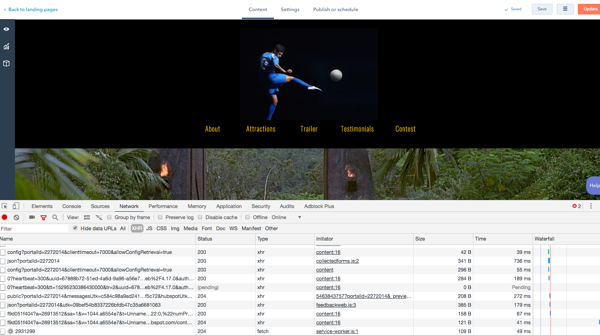
3. Re create the error
In order to understand what’s causing our error, we’ll first need to go through the same steps we took to get the error so that we can watch the request happen in real time. In this case, to recreate the error we’ll click Update again. By re-creating the error, we’ll see exactly which request is causing the issue.
4. Find the Red-Line Item in the Network Panel
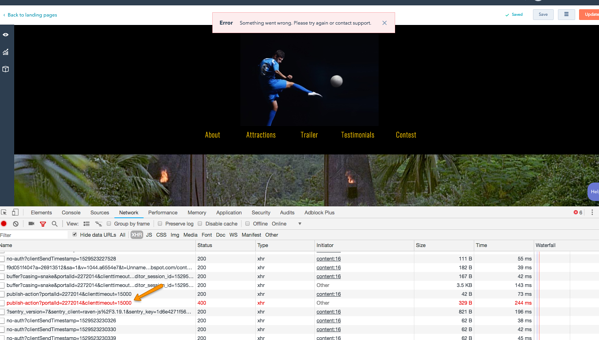
This is the error that occurs when clicking Update in HubSpot. The status is 400, which is the error code for “bad request.” Everything else has the status 200, which is the code for “OK,” meaning nothing went wrong for those other requests.
5. Preview the Error Details
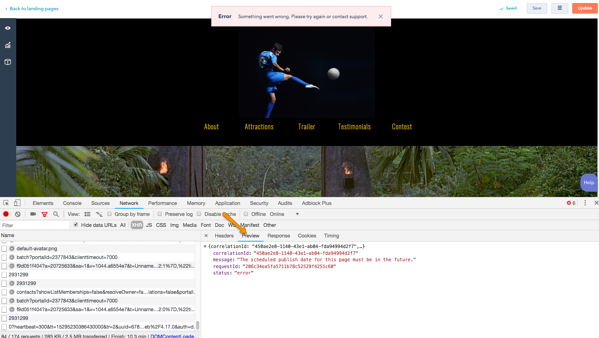
Click the red-line item to see the error details. Clicking that line item will open a new frame on the right-hand side, and in this frame you’ll see a few tabs: Headers, Preview, Response, Cookies, and Timing. In this case, stick with Preview since this contains the basic information.
6. View the Error Message
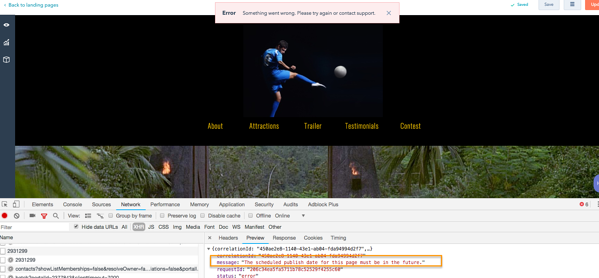
Thanks to the network panel, you were able to take a look under the hood, diagnose the issue. Share this message with us and we will try to troubleshoot your issue.
Want to learn more about the network panel? Check out Google’s documentation here for a deep dive into technical troubleshooting in your browser.
